
Friday, February 28, 2020
Get the Morning Brief sent directly to your inbox every Monday to Friday by 6:30 a.m. ET. Subscribe
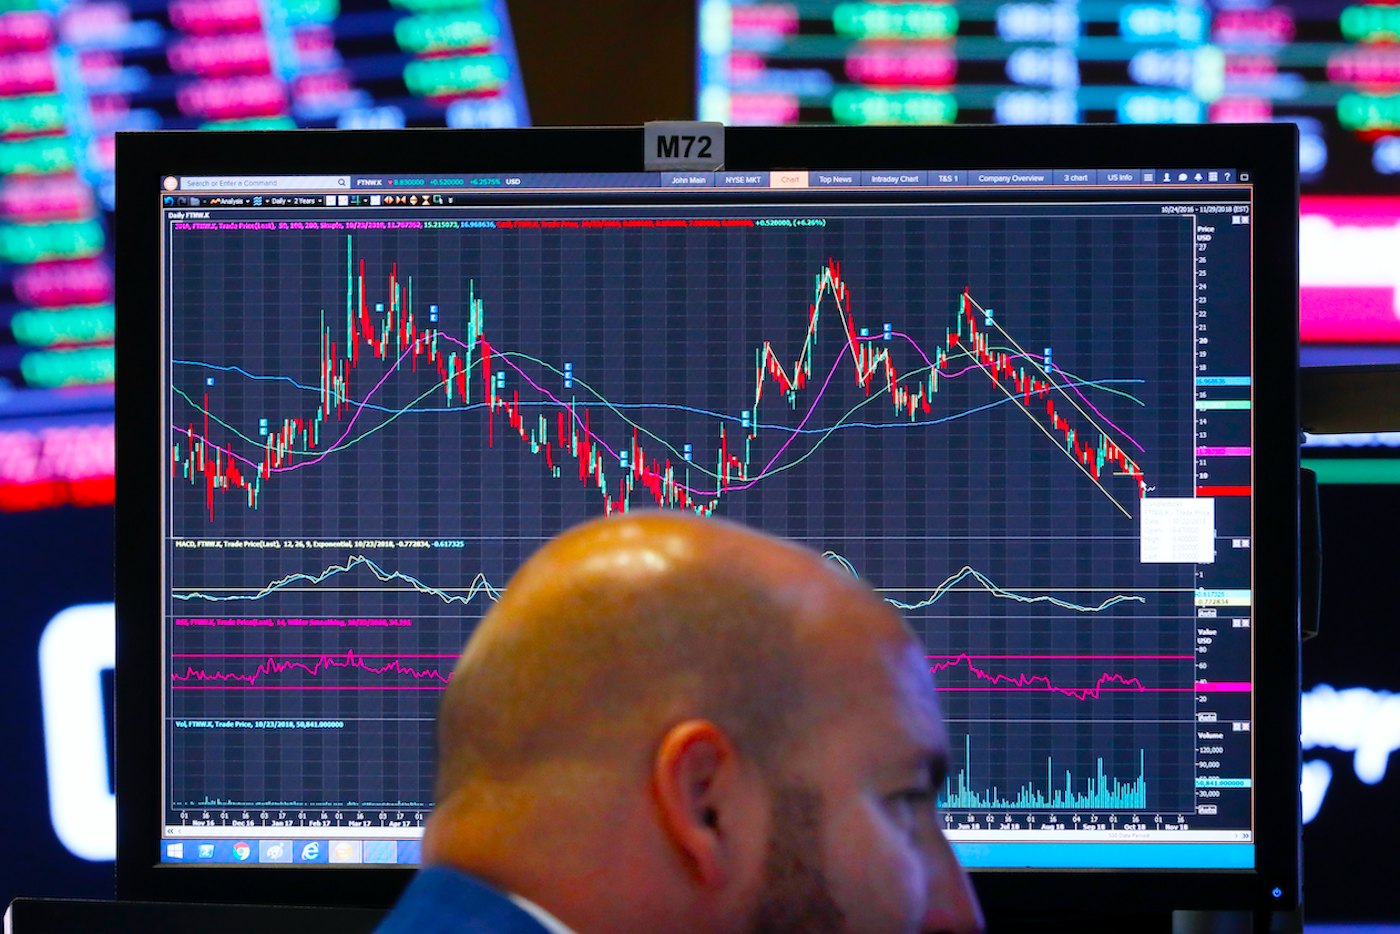
Investors have never seen anything like this
The market’s crazy week continued on Thursday.
After a mid-morning bounce, the market closed at its lows of the session with a final hour wipeout that results in all three major indexes falling more than 4%.
When the dust settled, the Dow fell 1,190 points, or 4.4%, its largest point decline in a single session on record while the S&P 500 fell 4.4% and the Nasdaq dropped 4.6%.
All three indexes are now in correction territory having dropped more than 10% from their most recent high.
And one chart from Deutsche Bank’s Torsten Sløk shows just how severe this decline has been and makes clear to investors that the coronavirus selloff doesn’t just feel like a unique market event — this time really is different.
A little over a week ago, on February 19, all three major indexes closed at record highs.
Strategists earlier this month made the case for staying “irrationally bullish” in this market. The S&P 500 had become in the mind of some investors a “safety trade” amid uncertainty over coronavirus and a freezing of the global economy.
And then the story changed completely.
Research from Goldman Sachs published late Wednesday noted that since World War II, the average S&P 500 correction sees stocks drop 13% and takes place over eight weeks — four weeks down, four weeks back up.
Bear markets, which are defined as drops of more than 20% from recent highs, see stocks fall 31% on average with a duration of 37 weeks — 14 weeks to the lows, 23 more weeks to recover losses.
The coronavirus selloff, however is in a category of its own.
“In recent years, with rising vol of vol, drawdowns have been faster and sharper which is in part due to positioning,” Goldman notes.
And so in some sense, this decline we’re seeing in the market is part of a longer-term trend towards faster, more violent dislocations in markets. Market events around 2016 political events, volatility blowups in February 2018, and the coronavirus market moves are unique events but also of a piece, a representation of how quickly risk is priced in the modern market.
But this is of little comfort to investors that have seen trillions of dollars in value wiped out of global stocks in just a few days.
By Myles Udland, reporter and co-anchor of The Final Round. Follow him at @MylesUdland
What to watch today
Economy
-
8:30 a.m. ET: Advanced goods trade balance, January (-$68.5 billion expected, -$68.3 billion prior)
-
8:30 a.m. ET: Wholesale inventories, January preliminary (-0.2% prior)
-
8:30 a.m. ET: Personal income, January (0.3% expected, 0.2% prior); Personal spending, January (0.3% expected, 0.3% prior); PCE deflator month on month, January (0.1% expected, 0.3% prior); PCE deflator year on year, January (1.8% expected, 1.6% prior); PCE core deflator year on year, January (1.7% expected, 1.6% prior)
-
9:45 a.m. ET: MNI Chicago PMI, February (46.3 expected, 42.9 prior)
-
10 a.m. ET: University of Michigan Sentiment, February final (100.6 expected, 100.9 prior)
Earnings
Pre-market
-
6:45 a.m. ET: Foot Locker (FL) is expected to report adjusted earnings of $1.58 per share on $2.25 billion in revenue
-
7 a.m. ET: Wayfair (W) is expected to report an adjusted loss of $2.68 per share on $2.52 billion in revenue
Top News
[Bloomberg]
[Reuters]
Beyond Meat beats on Q4 earnings, founder says 'we would be crazy not to invest in growth right now' [Yahoo Finance]
YAHOO FINANCE HIGHLIGHTS
Biocontainment expert on coronavirus: There's no need for average people to panic yet
Coronavirus-canceled events: A rolling list of scrapped plans amid the outbreak
Is the Consumer Financial Protection Bureau constitutional? The U.S. Supreme Court will decide
—
Follow Yahoo Finance on Twitter, Facebook, Instagram, Flipboard, SmartNews, LinkedIn, YouTube, and reddit.
Find live stock market quotes and the latest business and finance news
For tutorials and information on investing and trading stocks, check out Cashay
"severe" - Google News
February 28, 2020 at 05:58PM
https://ift.tt/398NbvK
One stunning chart shows how severe this selloff has been: Morning Brief - Yahoo Finance
"severe" - Google News
https://ift.tt/2OrY17E
Shoes Man Tutorial
Pos News Update
Meme Update
Korean Entertainment News
Japan News Update
Bagikan Berita Ini


0 Response to "One stunning chart shows how severe this selloff has been: Morning Brief - Yahoo Finance"
Post a Comment