
Nexstar Media Group’s stock (NASDAQ: NXST), the largest television station owner and operator in the U.S. with 198 stations, at $114 is currently only 11% below its pre-Covid peak of $128 in February 2020. And, we believe that the stock could see a much stronger upside once the Covid-19 fear abates. Nexstar’s market-leading stations, sites, and local broadcast could undeniably bring in higher advertising dollars with an expected rebound in economic activities. To add some perspective, Nexstar derives approximately 70% of its non-political advertising revenue from local businesses - which is an important source of revenue for the company and is generated by selling ad time to businesses such as restaurants and retailers. While the company evidently benefited from the Presidential elections in the first nine months of fiscal 2020, (as its political advertising revenue increased from around $15 million in 2019 to a whopping $209 million in 2020 ), the company’s core advertising and distribution revenue also grew by a robust 36% and 76%, respectively, during this period. In fact, distribution revenue accounted for 48% of its revenue higher than advertising’s 43% share, indicating that the company is beginning to depend less on the volatile advertising segment.
Our conclusion is based on our detailed comparison of Nexstar Media Group’s stock performance during the current crisis with that during the 2008 recession in an interactive dashboard analysis.
2020 Coronavirus Crisis
Timeline of 2020 Crisis So Far:
- 12/12/2019: Coronavirus cases first reported in China
- 1/31/2020: WHO declares a global health emergency.
- 2/19/2020: Signs of effective containment in China and hopes of monetary easing by major central banks helps S&P 500 reach a record high
- 3/23/2020: S&P 500 drops 34% from the peak level seen on Feb 19, as Covid-19 cases accelerate outside China. Doesn’t help that oil prices crash in mid-March amid a Saudi-led price war
- Since 3/24/2020: S&P 500 recovers 68% from the lows seen on Mar 23, 2020, as the Fed’s multi-billion dollar stimulus package suppresses near-term survival anxiety and infuses liquidity into the system.
Nexstar Media Group Performance During 2020 Coronavirus
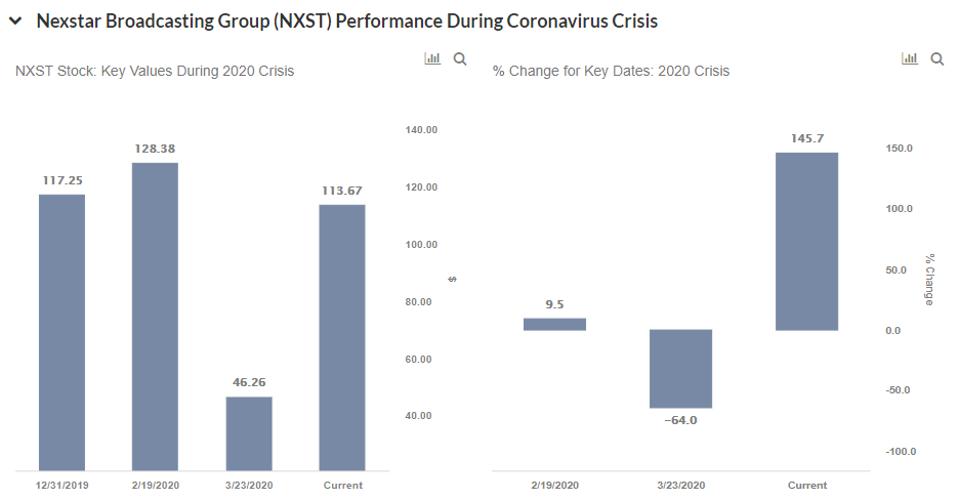
NXST’s stock declined from levels of around $128 in mid-February (the pre-crisis peak) to roughly around $46 as of March 23 (as the markets bottomed out) - implying that the stock lost as much as 64% of its value from its approximate pre-crisis level. It then rallied to levels of around $114, rising by 146% since March 23. It is still 3% lower than compared to levels seen in early January 2020.
S&P 500 Index Performance During 2020 Coronavirus/Oil Price War Crisis
The S&P 500 index declined from levels of around 3,386 in mid-Feb (pre-crisis peak) to levels of around 2,237 as of Mar 23 (as the markets bottomed out), implying the index lost 34% of its value from its approximate pre-crisis peak. It then rallied to levels of about 3,718 currently, rising by 66% since Mar 23. It is also up 15% from levels of 3,231 seen in early January 2020.
2007-08 Financial Crisis
Timeline of 2007-08 Crisis
- 10/1/2007: Approximate pre-crisis peak in S&P 500 index
- 9/1/2008 - 10/1/2008: Accelerated market decline corresponding to Lehman bankruptcy filing (9/15/08)
- 3/1/2009: Approximate bottoming out of S&P 500 index
- 1/1/2010: Initial recovery to levels before accelerated decline (around 9/1/2008)
Nexstar Media Stock Performance Over 2007-08 Financial Crisis
NXST stock witnessed something worse during the 2008 downturn. NXST’s stock declined from levels of over $9 in October 2007 (the pre-crisis peak) to roughly 65 cents in March 2009 (as the markets bottomed out) - implying that the stock lost as much as 93% of its value from its approximate pre-crisis peak. However, NXST’s stock recovered post the 2008 crisis, to levels of about $4 in early 2010, rising by 438% between March 2009 and January 2010.
S&P 500 Performance Over The 2007-08 Financial Crisis
S&P 500 Index fell 51% from levels of 1,540 in September 2007 to 757 in March 2009. It then rallied to levels of 1,124 - rising by about 48% between March 2009 and January 2010.
Fundamentals
How Do Nexstar Media Group’s Fundamentals Look In Recent Years?
Nexstar’s revenues grew a robust 173% from $1.1 Bil in 2016 to $3.0 Bil in 2019. In addition, earnings growth, on a per-share basis, was higher by 68% from $2.98 in 2016 to $5.01 in 2019.
Survival Check
Does Nexstar Media Group Have A Sufficient Cash Cushion To Meet Its Obligations Through The Coronavirus Crisis?
Nexstar’s liquidity was approximately $410 million in cash (as of Sept 30), with access to another $200 million under its revolving credit facility. The company’s total debt increased from $4.0 billion in 2018 to $8.5 billion in 2019 (due to the merger with Tribune Media Company), currently standing at around $7.9 billion at the end of Q3.
CONCLUSION
Phases of Covid-19 crisis:
- Early- to mid-March 2020: Fear of the coronavirus outbreak spreading rapidly translates into reality, with the number of cases accelerating globally
- Late-March 2020 onward: Social distancing measures + lockdowns
- April 2020: Fed stimulus suppresses near-term survival anxiety
- May-June 2020: Recovery of demand, with the gradual lifting of lockdowns - no panic anymore despite a steady increase in the number of cases
- Since late 2020: Weak quarterly results, but continued improvement in demand and progress with vaccine development buoy market sentiment
Despite the recent surge in the number of new Covid-19 cases in the U.S., we expect continued improvement in demand to buoy market expectations. As investors focus their attention on expected 2021 results, we believe Nexstar Broadcasting Group stock has the potential for strong gains once fears surrounding the Covid outbreak are put to rest.
Trefis
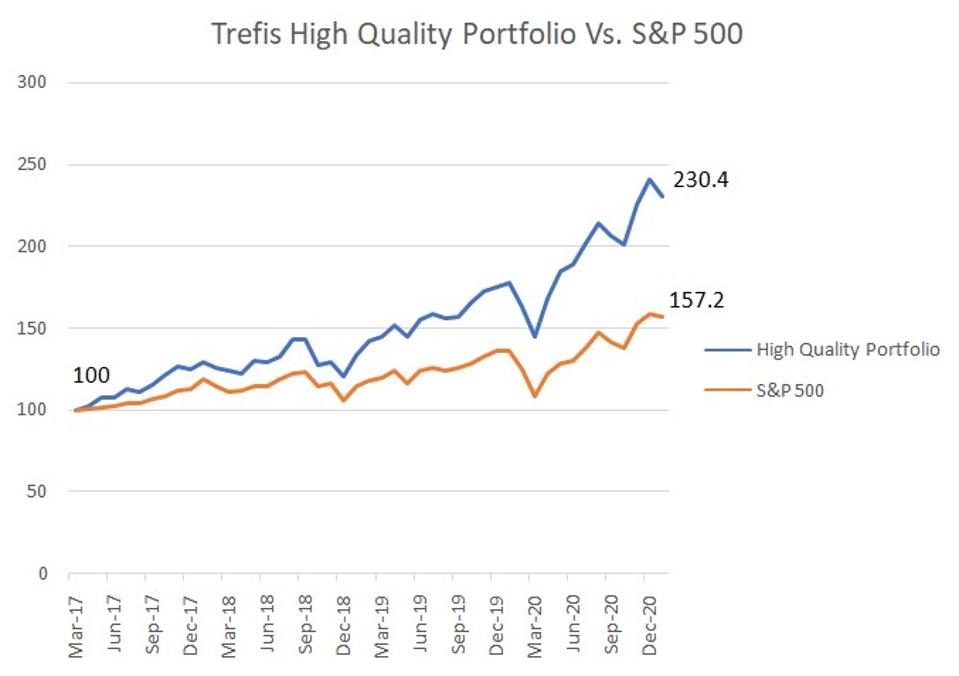
What if you’re looking for a more balanced portfolio instead? Here’s a high quality portfolio to beat the market, with over 100% return since 2016, versus 55% for the S&P 500. Comprised of companies with strong revenue growth, healthy profits, lots of cash, and low risk, it has outperformed the broader market year after year, consistently.
See all Trefis Price Estimates and Download Trefis Data here
What’s behind Trefis? See How It’s Powering New Collaboration and What-Ifs For CFOs and Finance Teams | Product, R&D, and Marketing Teams
"peak" - Google News
February 02, 2021 at 07:30PM
https://ift.tt/3cuONV7
Nexstar Stock Down Only 11% From 2020 Peak, What’s Next? - Forbes
"peak" - Google News
https://ift.tt/2KZvTqs
https://ift.tt/2Ywz40B
Bagikan Berita Ini


0 Response to "Nexstar Stock Down Only 11% From 2020 Peak, What’s Next? - Forbes"
Post a Comment